2014年3月25日 星期二

A few thoughts about the normalization of IR sensor outputs

I found some interesting things when I tried to determine what the best resistor values were for limiting the current flowing through the infrared LEDs.
  1. If I assume that the light emitted from the IR LED is of cone shape in 3D, then the projection on the ground would mostly in our case be an ellipse.
  2. The long axis of the ellipse that created by the center LED sits on the moving direction of my Robotracer, Beetle.
  3. It is observed that when I try to move my Robotracer to cross the line and record the sensor readings along the way, there would be a small part of the sensor readings that seems not changed (see Figure 1).  The reason for this observation can be illustrated by using Figure 2.
  4. Therefore, the maximum of the sensor readings when crossing the line would be smaller than that when the robotracer is running.  This, I think, makes my line position estimation (weighted average) give error results at some point, not always.  I seem to solve this problem by lowering the normalized sensor output range, from [50, 900] to [50, 750], and by purposely making the maximum values of those raw IR sensor readings larger (multiplied by 1.3).  This deserves more investigation.  I came up with this solution because I thought when the robotracer try to correct the sensor readings with the normalization parameters I got from moving the robotracer to cross the line, may make the reading corrections exceeds the variable type limit (I use unsigned int for sensor readings).  A second thought on this problem shows the guess may not be true.
Fig.1 Sensor readings of the Robotracer, Beetle, when crossing the line

Fig. 2.  The projections of the IR LEDs on the ground of the Robotracer, Beetle.  (left) when the robotracer is running, and (right) when it records the sensor outputs for normalization


2014年3月12日 星期三

Robotracer Beetle: Normalization of infrared sensor outputs


This is my robotracer, Beetle, and I have almost finished checking its capabilities.  The only thing left is to write data to the flash memory of the microcontroller, dsPICmc806.

The followings are experimental results for its normalization of infrared (IR) sensor outputs.  The data of 7 IR sensor outputs is obtained when I push Beetle to cross a horizontal white line.

The first figure shows the results when the ground material is similar to that used in Taiwan's contest.

Currently, I have no idea about why the shape of the sensor outputs do not look like bell.  Is it because the angle between the emitting line of IR LEDs and the ground is about 60 degrees? This makes the projection of the light on the ground similar to the shape of a rain drop (according to theory, the shape should be an ellipse if the light emitted from IR LEDs are cones).

The following figure shows the theoretical prediction of the projection of my LEDs on the ground. (I write a MATLAB program to produce the figure)


All the maximum and minimum values of the sensor outputs are mapped using a linear function to 900 and 50, which is shown at the bottom half of the figure.

The mapping function is
$y = y_{min} + (y_{max} - y_{min})/(x_{max} - x_{min})(x - x_{min})$
The following are the results when I used a printed track on a poster, and the reflection ratio is larger than that of the contest ground.
03/20/2014
The previous experimental results seem to suffer residual voltage problem (D2 is the most obvious one), because I did not wait some time to let the residual voltage from the other LED reflected light dies out, and sample immediately after the previous sampling process ends.  The followings are revised version for both poster and contest ground normalization.


From tomorrow on, I will try to find out the impact of the differences on the estimation of the position of line tracks.

迴圈線迷宮(looped line maze)的搜尋與路徑簡化

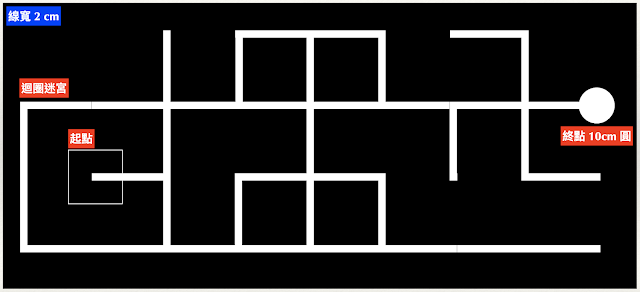
迴圈線迷宮(如下圖),專指一個由直交線段組成的迷宮中,包含「迴圈」的路徑。在每年教育部主辦的「 電腦鼠暨智慧輪型機器人競賽 」中,屬於高中職與大專組的「 線迷宮鼠 」競賽活動。規則請參考以下連結  https://sites.google.com/gm.lhu.edu.tw/20...